Scrapingant Overview
In Scrapeway's latest benchmark (May 2026), Scrapingant achieved a 36% overall success rate across 12 target websites, ranking #8 out of 8 tested APIs, with an average response time of 16.3s and a cost of $1.11 per 1,000 requests.
Scrapingant has been founded in 2020 with goal of revolutionizing the world of web data extraction, making it blockage-free and hassle-free.
Overall ScrapingAnt performs relatively well on Scrapeway's benchmarks supporting most web scraping targets and bypassing most anti-bot measures.
ScrapingAnt offers feature set on par with the industry average with features like headless browser scraping, anti-bot bypass and residential proxy support. Uniquely it provides special APIs for specific web scraping targets.
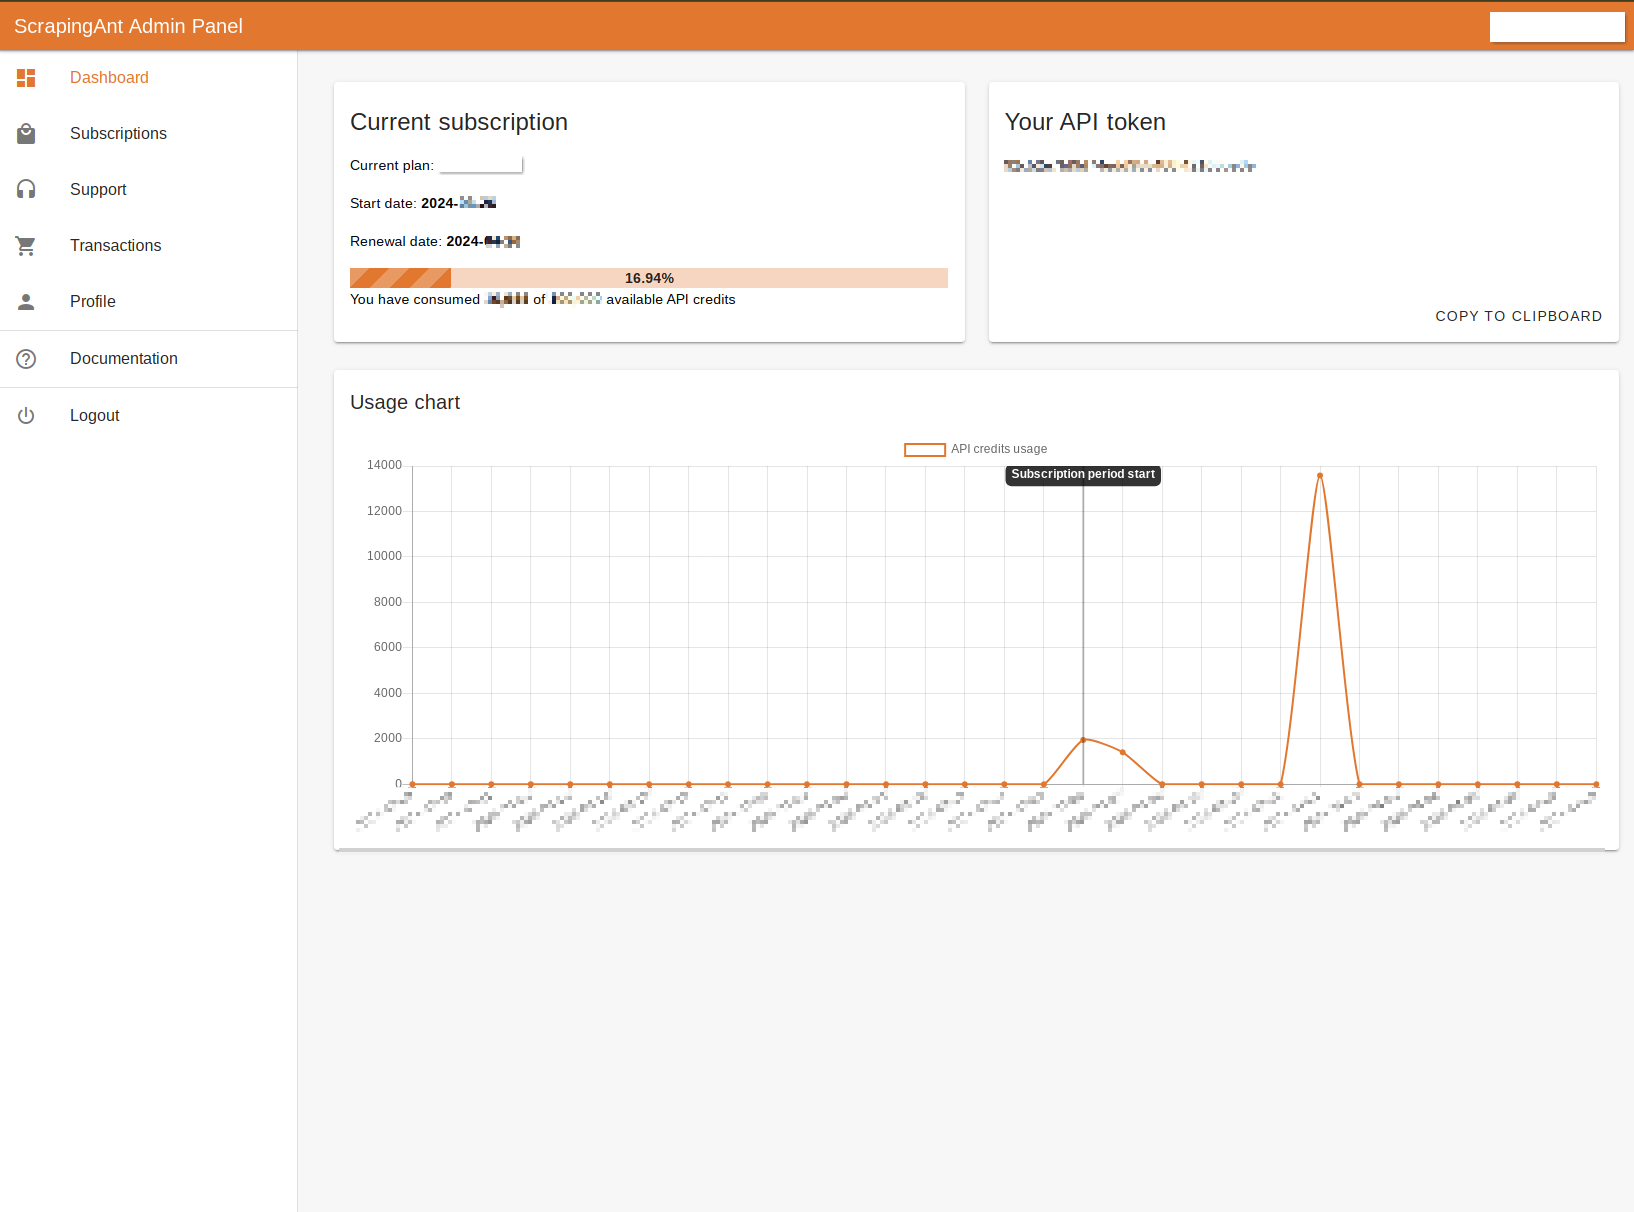
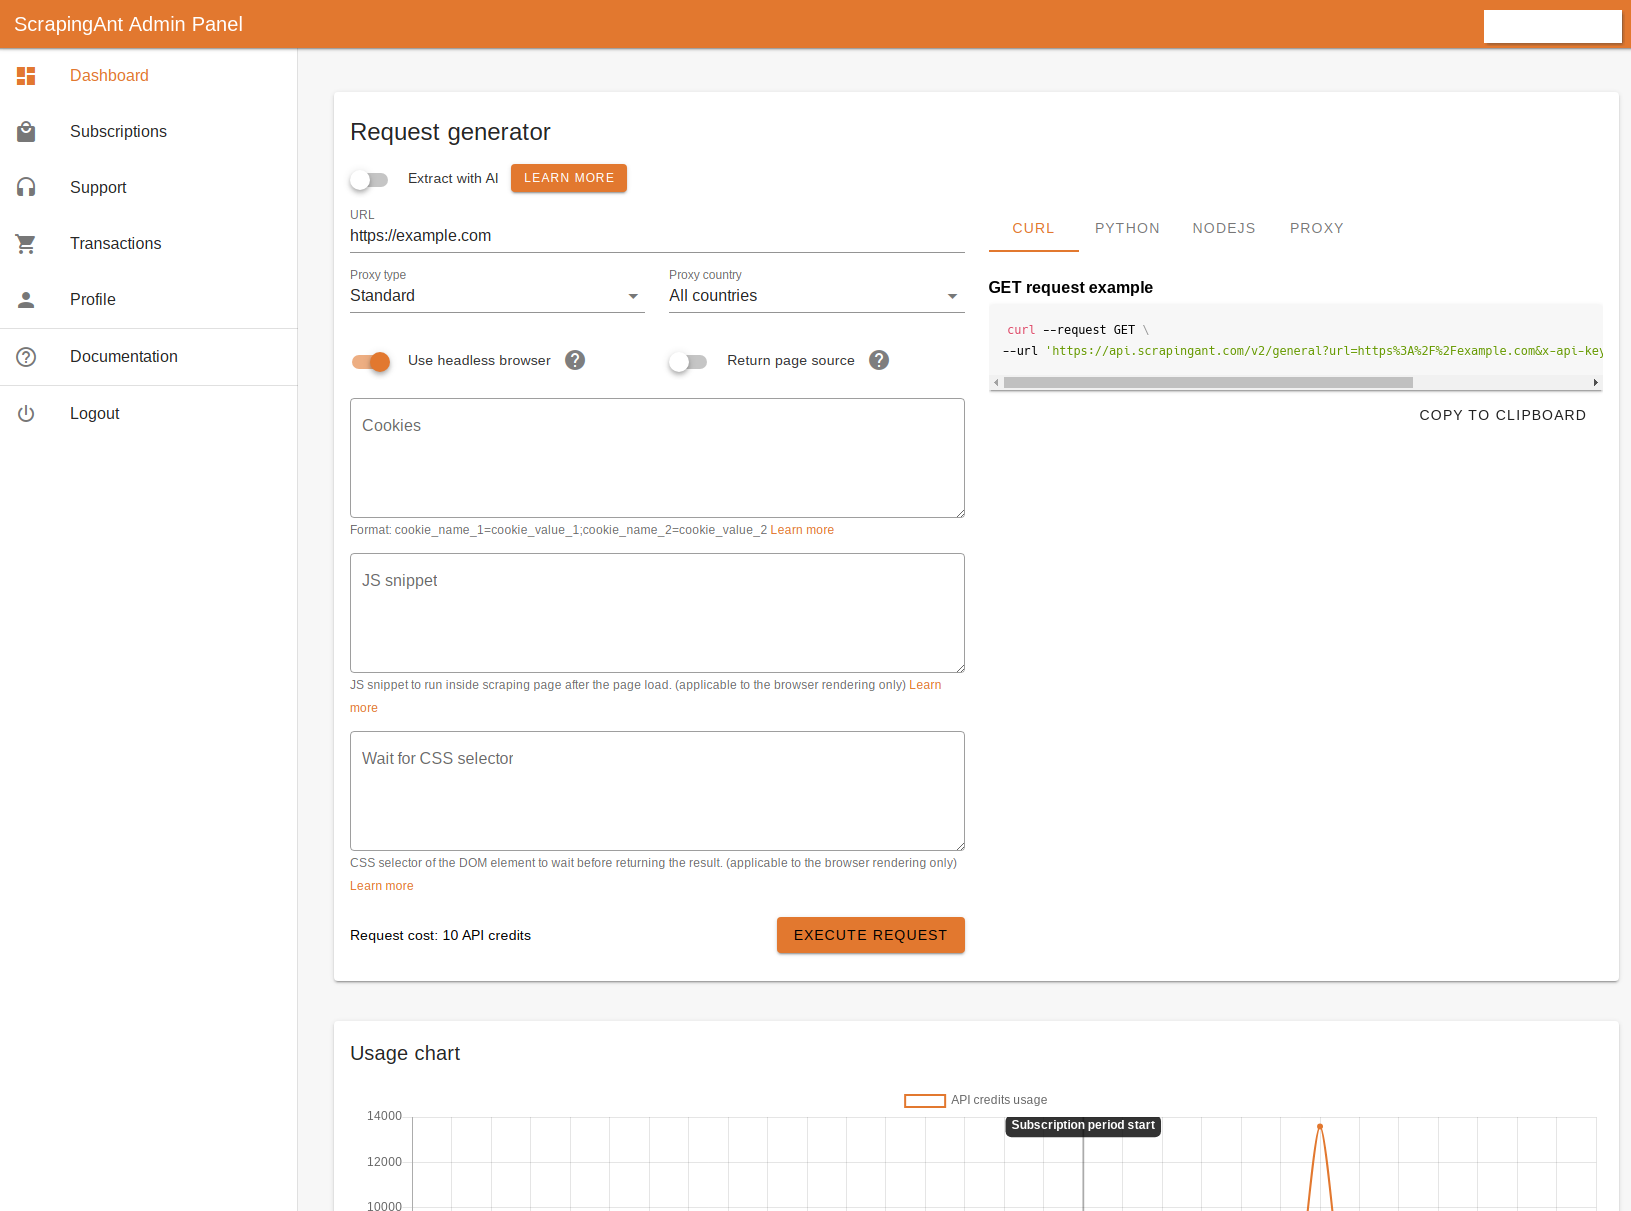
- Unlimited concurrency.
- Low entry point of 19$.
- Integrations for Python and Javascript
- Optional Javascript rendering for scraping dynamic pages.
- Optional AI-powered structured data parser.
- Web UI player for testing and experimenting.
- Poor scraper blocking bypass.
- Often charges for blocked requests.
- Basic web UI.
- Credits do not carry over month-to-month.
How Scrapingant compares against other web scraping APIs in success rate, speed and cost.

- Scrapingant has a below-average success rate of 35.8% vs industry average 62.4%
- Scrapingant has a below-average speed of 16.3s vs industry average 9.7s
- Scrapingant has a below-average price of $1.1/1000 vs industry average $3.3
Per-target benchmark results from our latest report.
Scrapingant Pricing
ScrapingAnt is a credit-based service where each scrape request can cost 1-25 credits depending on the used features and required anti-bot bypass.
| Plan | Price | Credits | Concurrency |
|---|---|---|---|
| Enthusiast | 19 | 100,000 | unlimited |
| Startup | 49 | 500,000 | unlimited |
| Pro | 249 | 3,000,000 | unlimited |
| Custom | — | — | — |
ScrapingAnt's entry tier is well above the industry average offering a great option for small projects. Though it averages out on the higher end for larger projects.
Scrapingant Features
Overall, ScrapingAnt focuses on core features aligned with the industry average. It offers the standard feature set for all plans:
| Feature | Availability |
|---|---|
| Integrations | Python, Javascript |
| Proxy support | Datacenter default, Residential optional |
| Geolocation | 15 countries |
| Webhook support | Yes |
| Javascreipt rendering | Yes, at extra cost |
| Custom JS evaluation | Yes, up to 60s |
| Browser control | No |
| Screenshots | Yes, full or visible page only |
| Sessions | Yes, persistent IP |
To add, ScrapingAnt offers some unique features at no extra cost included with every plan:
- Autoparse for select targets that outputs structured JSON.